other · Environmental science & technology · la publicación, 1 oct 2026 · gratis
Uno de cada cuatro centros de datos opera en zonas con escasez de agua
Científicos ubicaron 9,347 instalaciones en el mundo mediante modelos de cuencas hidrológicas, sin medir el consumo directo de cada edificio.
Versión breve · la versión detallada sigue, unos 5 min
Pregunte al chat de weeklyAI
Pregúnteme sobre la IA en su vida: le señalo las notas que weeklyAI ha publicado sobre el tema, esta semana y antes.
Las conversaciones se guardan mientras exista weeklyAI, para mejorar la publicación. Se responde en el idioma en que usted escribe.
- El estudio, de un vistazo
- Quiénes
- Centros de datos identificados en el mundo
- Cuántos
- 9,347
- Dónde
- Todo el mundo; Estados Unidos alberga 39% del total
- Cuándo
- Condiciones hidrológicas de 2001 a 2010; escenario futuro de 3 °C
- Tipo de estudio
- análisis de ubicaciones cruzadas con modelos hidrológicos
- Quién lo hizo
- Carnegie Institution for Science, Stanford, Politécnico de Milán, Universidad de Texas en Austin y ETH de Zúrich
- El límite que importa
- No midió el consumo de agua de ninguna instalación; solo su ubicación.
Porcentaje de los centros de datos del mundo ubicados en zonas donde ese sector es el que más agua consume; no mide competencia ni conflicto, solo cercanía.
Centros de datos en zonas con déficit de agua: hoy y con 3 °C de calentamiento
Pasa de 25% a 33% de los centros identificados
El estudio no midió el consumo de ninguna instalación. Solo comparó dónde están con dónde falta el agua.
El número es 2,315: representa una cuarta parte de los 9,347 centros de datos identificados en el mundo. Esas instalaciones se encuentran en sitios donde la demanda de agua supera los recursos renovables al menos un mes al año, según las condiciones registradas entre 2001 y 2010.
Investigadores de la Institución Carnegie para la Ciencia y de la Universidad de Stanford compararon las coordenadas de estos centros con un modelo de balance hídrico regional. El cálculo parte del agua que corre por los ríos y le resta la que se reserva para mantener sanos los ecosistemas.
Estados Unidos alberga 3,619 de estas instalaciones, el 39% del total mundial. En ese país, el 21% de los centros se ubica en regiones con poca agua, donde el cruce con la demanda de los hogares y del riego agrícola es marcado. Ahí el cruce con la demanda de los hogares y del riego agrícola es marcado.
El 41% de los centros en el planeta está en zonas donde la mayor demanda de agua corresponde al servicio de agua potable de las ciudades. Otro 28% convive con el riego agrícola, y el 18% con la industria de manufactura.
El cálculo no midió el medidor de agua de ningún edificio en particular. Los autores carecían de datos sobre los sistemas de enfriamiento o el volumen que extrae cada inmueble. Además, los faltantes de agua representan una estimación máxima: el estudio no incorporó plantas desalinizadoras, trasvases entre cuencas ni las reglas locales de reparto.
Tampoco se evaluó si esta cercanía detiene las operaciones de las computadoras o si perjudica los pozos de los vecinos. Los autores señalan ese efecto como una pregunta abierta.
Bajo un escenario de calentamiento global de 3 grados centígrados, la cifra subiría al 33% de los centros existentes, alcanzando 3,045 edificios en zonas con déficit.
Cuando proyecten una de estas instalaciones cerca de su casa, busque la solicitud formal de concesión ante el organismo de cuenca y los registros de capacidad del operador de agua potable, en vez de mirar los folletos de la empresa.
Qué significa para usted
Si vive cerca de un terreno donde planean uno de estos edificios, pida en el municipio y en el organismo de cuenca la solicitud de agua y los registros del operador local. El estudio no midió el consumo de ningún centro ni probó que afecte a los vecinos; esos faltantes son una estimación máxima. Lo que puede seguir es si el permiso de agua se concede y con qué condiciones.
Rosa, L., Sangiorgio, M., Scanlon, B. R. et al. (2026). One Quarter of Global Data Centers are Located in Water-Stressed Areas. Environmental Science & Technology. https://doi.org/10.1021/acs.est.6c08088
Quién pagó: El artículo indica que los autores declaran no tener intereses financieros en conflicto y agradece a Saoradh Enterprise Partners LLC de Boulder, Colorado, por aportar el conjunto de datos de instalaciones de centros de datos de su Hydrogen Market Model; no dice quién financió el estudio ni si los financiadores tuvieron influencia.
Versión detalladaLos pasajes copiados del artículo, las ilustraciones y cada fuente con cuánto leímos de ella · 1038 palabras · unos 5 minLeerla →Cerrar
Un cuarto de los centros de datos del mundo ya está donde el agua no alcanza
Un estudio global cruza la ubicación de 9,347 instalaciones con mapas de escasez de agua. Lo que no puede decir es cuánta agua saca cada una.
Piense en el recibo del agua de su colonia y en el chorro que sale de la llave un martes de mayo, cuando ya no llueve desde febrero. Ahora piense en un edificio lleno de servidores que trabaja los 365 días del año sin parar. Ese edificio se enfría con agua.
Un estudio publicado en *Environmental Science & Technology* por Lorenzo Rosa y colegas del Carnegie Institution for Science, la Universidad de Stanford, el Politécnico de Milán, la Universidad de Texas en Austin y la ETH de Zúrich combinó la ubicación de 9,347 centros de datos identificados en todo el mundo con estimaciones de modelos climáticos e hidrológicos para calcular, mes a mes, dónde la demanda de agua supera a la que hay disponible. El hallazgo central: una cuarta parte de esas instalaciones, 2,315, ya habría pasado al menos un mes al año con más demanda de agua que oferta disponible, según las condiciones hidrológicas de 2001 a 20101. Con un calentamiento de 3 °C respecto a la era preindustrial, la cifra subiría a 33 por ciento, 3,045 instalaciones2.
Estados Unidos alberga 39 por ciento de los centros de datos, y 21 por ciento de ellos está en regiones con escasez de agua, donde el cruce con la demanda municipal y agrícola es marcado3. El estudio no midió el consumo de ninguna instalación. Solo comparó dónde están con dónde falta el agua.
Para entender qué hacen esos edificios con el agua, conviene ver el mecanismo. Los servidores generan calor y hay que enfriarlos; la forma más común es evaporar agua, y eso consume el recurso en lugar de solo tomarlo prestado4. Un sistema típico de enfriamiento evaporativo usa entre 1 y 3 metros cúbicos por megavatio-hora de carga informática, y otros 1 a 10 metros cúbicos por megavatio-hora van embebidos en la generación eléctrica cuando dominan las plantas termoeléctricas5. Un clúster de 1 gigavatio a alta utilización puede asociarse con 10 a 40 millones de metros cúbicos de demanda de agua al año, según el sistema de enfriamiento, la mezcla eléctrica y el clima local6.
Puesto en cifras globales, los centros de datos consumen hoy entre 313 y 764 mil millones de litros de agua al año, y las proyecciones apuntan a que esa cifra podría más que duplicarse hasta 1,200 mil millones de litros para 2030: el equivalente al consumo doméstico y municipal anual de un país como Países Bajos7. En electricidad consumen unos 415 teravatios-hora al año, alrededor de 1.5 por ciento de la demanda mundial8.
El estudio tiene límites que importan. No incluyó el consumo operativo de los centros de datos en el balance de agua: solo evaluó exposición por ubicación9. Los huecos de agua que calcula son un techo, no un piso, porque no representa transferencias entre cuencas, desalación, recarga de acuíferos, operación de presas ni derechos de agua10. Y la pregunta de fondo queda abierta: no se sabe si esa exposición se traduce en impactos operativos para los centros o en consecuencias medibles para otros usuarios del agua11.
Lo que sí encontró es con quién comparten cuenca. Globalmente, 41 por ciento de los centros de datos está en zonas donde domina la demanda municipal de agua, 28 por ciento donde domina el riego agrícola, 18 por ciento donde domina la manufactura y 8 por ciento donde domina la generación eléctrica12. Los autores anotan que los centros suelen tener capacidad financiera y prioridad institucional para asegurar agua cuando la hay, de modo que el riesgo principal quizá no sea para ellos sino para los otros usuarios de la misma cuenca13. Muchas de esas instalaciones se surten de la misma agua potable o tratada que las ciudades, y eso presiona sobre todo en picos de demanda14.
Así lo leemos nosotros. Cuando se anuncia un centro de datos en un municipio, la nota de prensa habla de empleos e inversión. Los números que importan para el recibo del agua y la luz rara vez aparecen ahí. Esperamos que en su zona la empresa negocie exenciones fiscales, terrenos o conexión a la red y al agua, y que esos acuerdos estén en actas del concejo y expedientes de la comisión reguladora, no en el boletín. Sabríamos que nos equivocamos si el proyecto paga por sí mismo la ampliación de la planta de agua y el tendido eléctrico, sin subsidio, y las actas lo muestran con cifras cerradas.
También esperamos que, donde ya hay un centro o se anuncia uno, el conflicto no sea solo por litros o kilovatios. Lo normal es que aparezca un grupo vecinal que exija datos medidos y que amarre el permiso de agua a la pregunta de quién decide sobre el territorio. Si las objeciones se quedan en quejas sueltas, sin solicitudes de información ni comparación entre lo pronosticado y lo medido, el permiso pasará sin que nadie pida cuentas.
Lo que falta para cerrar la brecha entre exposición y consumo real es dato a nivel de instalación: tecnología de enfriamiento, uso operativo, capacidad. Los propios autores escriben que integrar esa información permitiría pasar de estimar exposición a cuantificar demanda15.
Aquí hay algo que usted puede hacer antes de que se vote cualquier permiso. Pida por escrito en el ayuntamiento el convenio fiscal y el contrato de servicio de agua y luz del proyecto. Pregunte cuánto de la obra nueva lo paga el recibo de los vecinos. Solicite el volumen autorizado y el consumo medido del último año, y compare las dos cifras. Si en su colonia no hay nadie que haya hecho esa solicitud, cualquier vecino puede empezar.
Volvamos al chorro de la llave un martes de mayo. El estudio no dice que el centro de datos de su ciudad le esté quitando el agua. Dice que una de cada cuatro de esas instalaciones en el mundo ya está en una cuenca donde la demanda supera lo que hay. La pregunta que queda para su mesa: ¿cuánta agua tiene autorizada esa instalación, y cuánta usó de verdad el año pasado?
De dónde sale cada dato de contexto, y cuánto leímos de cada documento
- Rosa, L., Sangiorgio, M., Scanlon, B. R. et al. (2026). One Quarter of Global Data Centers are Located in Water-Stressed Areas. Environmental Science & Technology. https://doi.org/10.1021/acs.est.6c08088 - el artículo del que trata esta nota — el artículo completo — el pasaje: "We find that 25% of data centers would already have experienced at least 1 month of water gap annually under 2001–2010 hydrologic conditions."
- Rosa, L., Sangiorgio, M., Scanlon, B. R. et al. (2026). One Quarter of Global Data Centers are Located in Water-Stressed Areas. Environmental Science & Technology. https://doi.org/10.1021/acs.est.6c08088 - el artículo del que trata esta nota — el artículo completo — el pasaje: "33% of currently identified data centers would be in regions experiencing water gaps under future hydrological conditions."
- Rosa, L., Sangiorgio, M., Scanlon, B. R. et al. (2026). One Quarter of Global Data Centers are Located in Water-Stressed Areas. Environmental Science & Technology. https://doi.org/10.1021/acs.est.6c08088 - el artículo del que trata esta nota — el artículo completo — el pasaje: "The United States hosts 39% of data centers, with 21% located in water-scarce regions, where overlap with municipal and agricultural demands is pronounced."
- Rosa, L., Sangiorgio, M., Scanlon, B. R. et al. (2026). One Quarter of Global Data Centers are Located in Water-Stressed Areas. Environmental Science & Technology. https://doi.org/10.1021/acs.est.6c08088 - el artículo del que trata esta nota — el artículo completo — el pasaje: "Direct water use primarily stems from cooling processes required to keep servers operating efficiently, with further water demands associated with space conditioning."
- Rosa, L., Sangiorgio, M., Scanlon, B. R. et al. (2026). One Quarter of Global Data Centers are Located in Water-Stressed Areas. Environmental Science & Technology. https://doi.org/10.1021/acs.est.6c08088 - el artículo del que trata esta nota — el artículo completo — el pasaje: "Typical evaporative cooling systems require 1–3 m 3 of water per MWh of IT load, while an additional 1–10 m 3 of water per MWh is commonly embedded in electricity generation where thermal power plants dominate."
- Rosa, L., Sangiorgio, M., Scanlon, B. R. et al. (2026). One Quarter of Global Data Centers are Located in Water-Stressed Areas. Environmental Science & Technology. https://doi.org/10.1021/acs.est.6c08088 - el artículo del que trata esta nota — el artículo completo — el pasaje: "a 1-GW data center cluster operating at high utilization can therefore be associated with 10–40 million m 3 of water demand per year, depending on cooling architecture, power mix, and local climate."
- Rosa, L., Sangiorgio, M., Scanlon, B. R. et al. (2026). One Quarter of Global Data Centers are Located in Water-Stressed Areas. Environmental Science & Technology. https://doi.org/10.1021/acs.est.6c08088 - el artículo del que trata esta nota — el artículo completo — el pasaje: "Data centers currently consume 313–764 billion liters per year, with projections suggesting that this could more than double to 1200 billion liters by 2030, equivalent to the annual household and municipal water withdrawals of a country like The Netherlands."
- Rosa, L., Sangiorgio, M., Scanlon, B. R. et al. (2026). One Quarter of Global Data Centers are Located in Water-Stressed Areas. Environmental Science & Technology. https://doi.org/10.1021/acs.est.6c08088 - el artículo del que trata esta nota — el artículo completo — el pasaje: "Data centers currently consume about 415 TWh of electricity per year, around 1.5% of global demand."
- Rosa, L., Sangiorgio, M., Scanlon, B. R. et al. (2026). One Quarter of Global Data Centers are Located in Water-Stressed Areas. Environmental Science & Technology. https://doi.org/10.1021/acs.est.6c08088 - el artículo del que trata esta nota — el artículo completo — el pasaje: "This approach allows us to assess the degree to which data centers are in water-stressed regions while avoiding assumptions about heterogeneous cooling technologies and facility-specific water intensities."
- Rosa, L., Sangiorgio, M., Scanlon, B. R. et al. (2026). One Quarter of Global Data Centers are Located in Water-Stressed Areas. Environmental Science & Technology. https://doi.org/10.1021/acs.est.6c08088 - el artículo del que trata esta nota — el artículo completo — el pasaje: "However, these estimated water gaps should be interpreted as an upper-bound estimate because the analysis does not explicitly represent buffering and adaptation strategies, including interbasin water transfers, desalination, managed aquifer recharge, reservoir operations, and water rights or allocation mechanisms."
- Rosa, L., Sangiorgio, M., Scanlon, B. R. et al. (2026). One Quarter of Global Data Centers are Located in Water-Stressed Areas. Environmental Science & Technology. https://doi.org/10.1021/acs.est.6c08088 - el artículo del que trata esta nota — el artículo completo — el pasaje: "The extent to which this exposure translates into operational impacts for data centers themselves or into measurable consequences for other water users remains an open question to address."
- Rosa, L., Sangiorgio, M., Scanlon, B. R. et al. (2026). One Quarter of Global Data Centers are Located in Water-Stressed Areas. Environmental Science & Technology. https://doi.org/10.1021/acs.est.6c08088 - el artículo del que trata esta nota — el artículo completo — el pasaje: "Data centers overlap with water demands from municipal (41%), irrigation (28%), manufacturing (18%), and power generation (8%) sectors."
- Rosa, L., Sangiorgio, M., Scanlon, B. R. et al. (2026). One Quarter of Global Data Centers are Located in Water-Stressed Areas. Environmental Science & Technology. https://doi.org/10.1021/acs.est.6c08088 - el artículo del que trata esta nota — el artículo completo — el pasaje: "While water scarcity is often framed as a potential constraint on data center expansion, in practice, data centers typically have the financial capacity and institutional priority to secure water supplies whenever water is available. As a result, the primary risk may not be to data center operations themselves but to other water users within the same basins."
- Rosa, L., Sangiorgio, M., Scanlon, B. R. et al. (2026). One Quarter of Global Data Centers are Located in Water-Stressed Areas. Environmental Science & Technology. https://doi.org/10.1021/acs.est.6c08088 - el artículo del que trata esta nota — el artículo completo — el pasaje: "These facilities often rely on the same potable or treated municipal supplies, creating stress with urban users during periods of peak demand and constrained availability while also raising concerns about water quality as increased withdrawals and the discharge of heated or treated effluents place additional pressure on already stressed municipal and downstream systems."
- Rosa, L., Sangiorgio, M., Scanlon, B. R. et al. (2026). One Quarter of Global Data Centers are Located in Water-Stressed Areas. Environmental Science & Technology. https://doi.org/10.1021/acs.est.6c08088 - el artículo del que trata esta nota — el artículo completo — el pasaje: "Future work integrating facility-level data on cooling technologies, operational water use, and capacity would substantially strengthen this line of research, enabling a transition from exposure-based assessments to direct quantification of data center water demand on the global scale."
Rosa, L., Sangiorgio, M., Scanlon, B. R. et al. (2026). One Quarter of Global Data Centers are Located in Water-Stressed Areas. Environmental Science & Technology. https://doi.org/10.1021/acs.est.6c08088
Quién pagó: El artículo indica que los autores declaran no tener intereses financieros en conflicto y agradece a Saoradh Enterprise Partners LLC de Boulder, Colorado, por aportar el conjunto de datos de instalaciones de centros de datos de su Hydrogen Market Model; no dice quién financió el estudio ni si los financiadores tuvieron influencia.
other · Environmental science & technology · the paper, 1 Oct 2026 · free
A Quarter of the World's Data Centres Sit Where Water Runs Short
Researchers matched 9,347 data centre locations to a global water model. The model leaves out dams, transfers and water rights, so the shortfalls it finds are an upper bound.
Short version · the longer version follows, about 8 min
Ask the weeklyAI chat
Ask me about AI in your life: I point you to the stories weeklyAI has published on it, this week and before.
Conversations are saved for as long as weeklyAI exists, to improve the publication. Answers come in the language you write in.
- The study at a glance
- Who
- Data centres worldwide
- How many
- 9347
- Where
- Worldwide; the United States hosts 39% of them
- When
- Baseline 2001–2010; future under 3 °C warming
- Kind of study
- analysis of what people did
- Who did it
- Carnegie Institution for Science, Stanford, Milan, UT Austin, ETH Zurich
- The limit that matters
- Locations only, no facility water use; water gaps are an upper-bound estimate
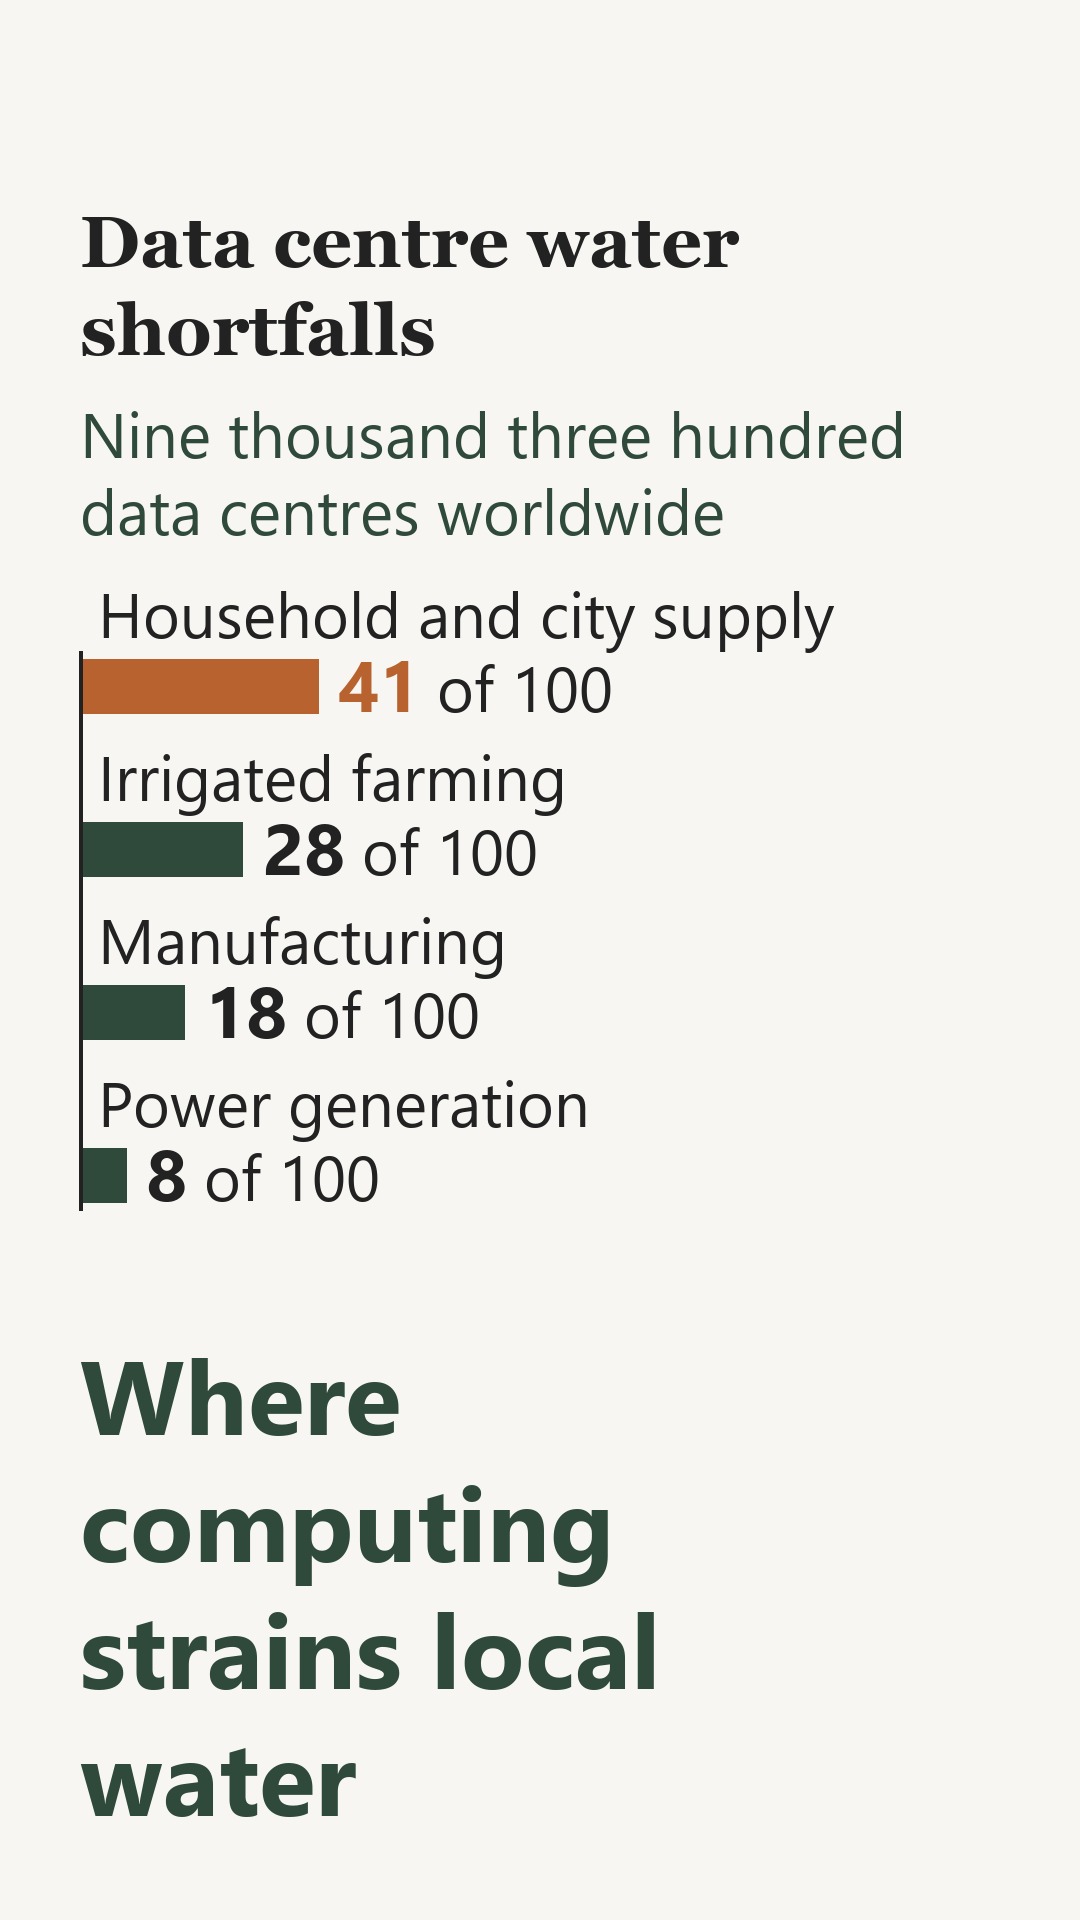
Share of the world's data centres sitting in areas where each sector uses the most water; the study shows where buildings stand, not how much water they draw.
Data centres facing at least one month a year of water shortfall: now versus a warmer future
25% now, rising to 33%
A data centre rarely loses a water argument. A farm or a household might.
Take 9,347 data centres, every one the researchers could identify worldwide. Put them on a map. Lay that map over a second one, showing where, month by month, the demand for water outruns what rain and rivers renew.
One in four of those buildings, 2,315 in all, sits in a place where the two maps overlap for at least one month a year. The work was done by researchers at the Carnegie Institution for Science and Stanford University, with colleagues at universities in Milan, Austin and Zurich.
The United States holds 3,619 of the 9,347, or 39 percent. Of those, 21 percent are in regions the study calls water-scarce. In those regions, the demand for water overlaps a lot with households and farms. Across the country, more than half of the facilities sit where households use the most water, and a fifth sit where farms do.
The study does not measure what any one facility draws. It knows only where each building stands, not how big it is, how it cools its servers, or how much water it uses. A data centre on the stressed side of the map may still be fine. The researchers call their gaps an upper bound, because the model does not account for water piped in from other basins, desalination, reservoirs, or the rules that decide who gets water first.
Nor can the study say whether this exposure hurts the data centre or the households, farms and power plants sharing the same basin. The authors state that plainly as an open question.
What they do say is that the stressed area is likely to grow. Under a scenario of 3 °C of warming, 3,045 sites, or 33 percent, would face water gaps.
Where a data centre is proposed near you, the useful document is not the company's own water figure. Ask the local water utility for its supply filing, and the regulator for the centre's water permit. Those papers, not a promise, show what the building would draw from the source you also drink from.
What this means for you
If a data centre is proposed near you, the water permit and the utility's supply filing are the documents that matter, since the study cannot say what any building actually draws. The study found that about a third of the sites would sit in areas short of water under a hotter climate. It counts places, and it does not weigh local fixes such as desalination, water moved between basins, stored water or water rights.
Rosa, L., Sangiorgio, M., Scanlon, B. R. et al. (2026). One Quarter of Global Data Centers are Located in Water-Stressed Areas. Environmental Science & Technology. https://doi.org/10.1021/acs.est.6c08088
Who paid: The article states the authors declare no competing financial interest and thanks Saoradh Enterprise Partners LLC of Boulder, Colorado, for providing the data centre facilities data set from their Hydrogen Market Model; it does not say who funded the study or whether funders had any say.
The longer versionThe passages copied from the paper, the pictures, and every source with how much of it we read · 1507 words · about 8 minRead it →Close
A Quarter of the World's Data Centres Sit Where Water Is Already Short
The first count of its kind puts 9,347 computer buildings on a map of local water deficits — and finds the United States holds 39% of them.
Start with the number on a water bill: a charge for water that, in some months, a region does not actually have. A new study in *Environmental Science & Technology* took all 9,347 data centres it could identify worldwide and laid their locations over a global model of monthly water gaps — places where, in a given month, demand for water outruns the renewable supply, so the deficit has to be pulled from groundwater, rivers, lakes or reserves set aside for ecosystems1. Under the hydrology of 2001 to 2010, the authors found that 25 per cent of those data centres — 2,315 facilities — would already have seen at least one month of water gap a year2. Under a future of 3 °C warming above pre-industrial conditions, the share rises to 33 per cent, or 3,045 sites3.
The country picture is lopsided. The United States hosts 39 per cent of the world's identified data centres, and 21 per cent of them sit in water-scarce regions, where the overlap with city supplies and farm demand is most pronounced4. Germany's 410 facilities face no water gaps at all; Spain's exposure is the highest in Europe, with 64 per cent of its facilities affected. In India, 73 per cent of facilities see at least one month of gap a year.
Consider what a data centre actually is: a building full of servers that must be kept cool, day and night. The direct water use comes mostly from that cooling, with some more for conditioning the air inside5. An evaporative cooling system typically needs between 1 and 3 cubic metres of water for every megawatt-hour of computing load, and where the electricity comes from thermal power plants, another 1 to 10 cubic metres per megawatt-hour is embedded in generating that power6. Put those together, and a 1-gigawatt cluster running hard can be tied to 10 to 40 million cubic metres of water demand a year, depending on how it is cooled, what powers it and where it stands7. A gigawatt is roughly the output of a large power station; the point is that this is a building that drinks like a small industry.
The scale of the sector is already large and growing. Data centres consume about 415 terawatt-hours of electricity a year, around 1.5 per cent of global demand8. Their water consumption is put at 313 to 764 billion litres a year, with projections that this could more than double to 1,200 billion litres by 2030 — about the household and municipal withdrawals of a country the size of the Netherlands9. The study's authors are from the Carnegie Institution for Science, Stanford, the Polytechnic of Milan, the University of Texas at Austin and ETH Zurich; the facility list came from a private firm, Saoradh Enterprise Partners, and the authors declare no competing financial interest.
Here is the part that decides who carries the cost. Globally, 41 per cent of data centres sit in places where the biggest water user is the municipal supply — the same treated water that goes to homes, hospitals and shops — followed by irrigated agriculture at 28 per cent, manufacturing at 18 per cent and power generation at 8 per cent10. Where a facility draws on that municipal supply, the authors write, it can create strain with urban users at peak demand and raise concerns about water quality as extra withdrawals and discharged warm or treated water press on already stressed systems11. And they make a blunt observation: data centres typically have the money and the institutional standing to secure water whenever it is available, so the main risk may fall not on the data centre's own operations but on the other water users in the same basin12. A data centre rarely loses a water argument. A farm or a household might.
Two limits matter more than any single figure. First, the study did not measure what any facility actually uses: it has locations only, with no capacity, cooling type or water source, so it assessed exposure by place rather than consumption13. Second, the water gaps are an upper-bound estimate, because the model does not represent interbasin water transfers, desalination, managed aquifer recharge, reservoir operations or water rights and allocation rules14. A region that looks dry on this map may in practice be buffered by a canal or a desalination plant. And the authors are explicit that whether this exposure turns into operational trouble for the data centres, or into measurable harm for other water users, remains an open question15.
What would settle it is the kind of data that does not yet exist globally: facility-level records of cooling technology, actual water use and capacity, which the authors say would move this field from exposure estimates to direct measurement of demand16. Other researchers are working on the supply side. One team has modelled desalination systems sized for data centres, and reports a cost of 3.2 dollars per cubic metre of permeate for a seawater hybrid system and 10.4 dollars per cubic metre for treating the much saltier produced water from oil and gas, according to the summary of that study; we could read only the summary, the full paper is behind a subscription1718. That same summary introduces a measure of how much a data centre's desalination adds to local water stress, and reports that it rose from 2023 to 2030 across the conditions tested19. Another summary, also read only in abstract, projects that AI's global water footprint could reach 4.2 to 6.6 billion cubic metres a year by 2027, and notes that many data centres are in water-stressed regions2021. It lists cold-climate siting, cooling with natural water bodies, waterless designs and waste-heat recovery as ways to cut on-site demand, adding that their deployment remains limited22. And it argues that water-sustainable AI needs policy reform that builds water limits into infrastructure planning, not just better technology23.
Here is how we read it. The pattern in this study is not really about computers: it is about who gets the water when a new, wealthy user moves into a basin that is already short. What that leads us to expect, in a place like yours, is that the loudest local argument will be about allocation rather than about whether the building is welcome — neighbours asking why a new large user gets priority over households and farms, and the answer coming from water rights and utility contracts, not from rainfall. We could be wrong: if residents near a proposed centre in a stressed basin pressed only for jobs and tax revenue and raised no objection to the water share, or if utilities routinely turned away large new users in stressed basins before any public dispute began, the expectation would fail. What you can do with it is concrete. At a council or utility hearing, ask who holds the water right the centre will use, whether it is a new right or one transferred from another user, and what happens to that share in a drought year. Watch whether the debate is framed as information — we have the data — or as allocation: who gives up what.
One more thing worth watching is the shape of the deal. Large users are often served on terms a household could never match: volumes reserved years ahead, minimum charges, or capacity set aside whether or not it is used. We are not saying this study found that; it did not examine contracts. We are saying that when a rate case or a water permit for a centre near you is filed, the questions to ask are whether the centre pays for its own peak or spreads that cost across all customers, and who bears the cost of the new substation or water main. If the filed tariff shows the centre paying only for what it draws, with no reserved minimum and no cost shifted to other ratepayers, that expectation fails too — and it would be worth saying so.
The authors' own conclusion is quieter than the headline. Ensuring data centres last, they write, will require siting and governance choices that account for local hydrological limits. That is a sentence about planning, not about technology. No facility in this study was shown to have run short of water, and no household was shown to have lost any.
So bring the map back to your own street. A data centre planned near you may draw on the same treated water as your tap, and this study can tell you whether your region is one where demand already outruns supply in some months. It cannot tell you what that particular building will use. The question to carry to the next planning meeting is the one the study leaves open: who holds the water right, and what happens to it in a dry year?
Where each piece of context comes from, and how much of it we read
- Rosa, L., Sangiorgio, M., Scanlon, B. R. et al. (2026). One Quarter of Global Data Centers are Located in Water-Stressed Areas. Environmental Science & Technology. https://doi.org/10.1021/acs.est.6c08088 - the article this story is about — the whole article — the passage: "This study assesses the current and future exposure of all 9347 currently identified data centers worldwide to water gap conditions, areas where water demand exceeds available supply, resulting in unsustainable water consumption and an increase in water stress."
- Rosa, L., Sangiorgio, M., Scanlon, B. R. et al. (2026). One Quarter of Global Data Centers are Located in Water-Stressed Areas. Environmental Science & Technology. https://doi.org/10.1021/acs.est.6c08088 - the article this story is about — the whole article — the passage: "We find that 25% of data centers would already have experienced at least 1 month of water gap annually under 2001–2010 hydrologic conditions."
- Rosa, L., Sangiorgio, M., Scanlon, B. R. et al. (2026). One Quarter of Global Data Centers are Located in Water-Stressed Areas. Environmental Science & Technology. https://doi.org/10.1021/acs.est.6c08088 - the article this story is about — the whole article — the passage: "33% of currently identified data centers would be in regions experiencing water gaps under future hydrological conditions."
- Rosa, L., Sangiorgio, M., Scanlon, B. R. et al. (2026). One Quarter of Global Data Centers are Located in Water-Stressed Areas. Environmental Science & Technology. https://doi.org/10.1021/acs.est.6c08088 - the article this story is about — the whole article — the passage: "The United States hosts 39% of data centers, with 21% located in water-scarce regions, where overlap with municipal and agricultural demands is pronounced."
- Rosa, L., Sangiorgio, M., Scanlon, B. R. et al. (2026). One Quarter of Global Data Centers are Located in Water-Stressed Areas. Environmental Science & Technology. https://doi.org/10.1021/acs.est.6c08088 - the article this story is about — the whole article — the passage: "Direct water use primarily stems from cooling processes required to keep servers operating efficiently, with further water demands associated with space conditioning."
- Rosa, L., Sangiorgio, M., Scanlon, B. R. et al. (2026). One Quarter of Global Data Centers are Located in Water-Stressed Areas. Environmental Science & Technology. https://doi.org/10.1021/acs.est.6c08088 - the article this story is about — the whole article — the passage: "Typical evaporative cooling systems require 1–3 m 3 of water per MWh of IT load, while an additional 1–10 m 3 of water per MWh is commonly embedded in electricity generation where thermal power plants dominate."
- Rosa, L., Sangiorgio, M., Scanlon, B. R. et al. (2026). One Quarter of Global Data Centers are Located in Water-Stressed Areas. Environmental Science & Technology. https://doi.org/10.1021/acs.est.6c08088 - the article this story is about — the whole article — the passage: "a 1-GW data center cluster operating at high utilization can therefore be associated with 10–40 million m 3 of water demand per year, depending on cooling architecture, power mix, and local climate."
- Rosa, L., Sangiorgio, M., Scanlon, B. R. et al. (2026). One Quarter of Global Data Centers are Located in Water-Stressed Areas. Environmental Science & Technology. https://doi.org/10.1021/acs.est.6c08088 - the article this story is about — the whole article — the passage: "Data centers currently consume about 415 TWh of electricity per year, around 1.5% of global demand."
- Rosa, L., Sangiorgio, M., Scanlon, B. R. et al. (2026). One Quarter of Global Data Centers are Located in Water-Stressed Areas. Environmental Science & Technology. https://doi.org/10.1021/acs.est.6c08088 - the article this story is about — the whole article — the passage: "Data centers currently consume 313–764 billion liters per year, with projections suggesting that this could more than double to 1200 billion liters by 2030, equivalent to the annual household and municipal water withdrawals of a country like The Netherlands."
- Rosa, L., Sangiorgio, M., Scanlon, B. R. et al. (2026). One Quarter of Global Data Centers are Located in Water-Stressed Areas. Environmental Science & Technology. https://doi.org/10.1021/acs.est.6c08088 - the article this story is about — the whole article — the passage: "Data centers overlap with water demands from municipal (41%), irrigation (28%), manufacturing (18%), and power generation (8%) sectors."
- Rosa, L., Sangiorgio, M., Scanlon, B. R. et al. (2026). One Quarter of Global Data Centers are Located in Water-Stressed Areas. Environmental Science & Technology. https://doi.org/10.1021/acs.est.6c08088 - the article this story is about — the whole article — the passage: "These facilities often rely on the same potable or treated municipal supplies, creating stress with urban users during periods of peak demand and constrained availability while also raising concerns about water quality as increased withdrawals and the discharge of heated or treated effluents place additional pressure on already stressed municipal and downstream systems."
- Rosa, L., Sangiorgio, M., Scanlon, B. R. et al. (2026). One Quarter of Global Data Centers are Located in Water-Stressed Areas. Environmental Science & Technology. https://doi.org/10.1021/acs.est.6c08088 - the article this story is about — the whole article — the passage: "While water scarcity is often framed as a potential constraint on data center expansion, in practice, data centers typically have the financial capacity and institutional priority to secure water supplies whenever water is available. As a result, the primary risk may not be to data center operations themselves but to other water users within the same basins."
- Rosa, L., Sangiorgio, M., Scanlon, B. R. et al. (2026). One Quarter of Global Data Centers are Located in Water-Stressed Areas. Environmental Science & Technology. https://doi.org/10.1021/acs.est.6c08088 - the article this story is about — the whole article — the passage: "This approach allows us to assess the degree to which data centers are in water-stressed regions while avoiding assumptions about heterogeneous cooling technologies and facility-specific water intensities."
- Rosa, L., Sangiorgio, M., Scanlon, B. R. et al. (2026). One Quarter of Global Data Centers are Located in Water-Stressed Areas. Environmental Science & Technology. https://doi.org/10.1021/acs.est.6c08088 - the article this story is about — the whole article — the passage: "However, these estimated water gaps should be interpreted as an upper-bound estimate because the analysis does not explicitly represent buffering and adaptation strategies, including interbasin water transfers, desalination, managed aquifer recharge, reservoir operations, and water rights or allocation mechanisms."
- Rosa, L., Sangiorgio, M., Scanlon, B. R. et al. (2026). One Quarter of Global Data Centers are Located in Water-Stressed Areas. Environmental Science & Technology. https://doi.org/10.1021/acs.est.6c08088 - the article this story is about — the whole article — the passage: "The extent to which this exposure translates into operational impacts for data centers themselves or into measurable consequences for other water users remains an open question to address."
- Rosa, L., Sangiorgio, M., Scanlon, B. R. et al. (2026). One Quarter of Global Data Centers are Located in Water-Stressed Areas. Environmental Science & Technology. https://doi.org/10.1021/acs.est.6c08088 - the article this story is about — the whole article — the passage: "Future work integrating facility-level data on cooling technologies, operational water use, and capacity would substantially strengthen this line of research, enabling a transition from exposure-based assessments to direct quantification of data center water demand on the global scale."
- Katakam VSS, Arzumanyan M, Lin N, Bahadur V. (2027). System-scale design and analysis of desalination systems for meeting water needs of data centers. Water Research. 10.1016/j.watres.2026.126748 — only the abstract - the full paper is behind a subscription — the passage: "Results show FR = 736 L/1000 kg-feed, Winp = 9.4 kWh/m³-permeate and WC = 3.2 $/m³-permeate for seawater hybrid RO-MVC-based treatment with MLD disposal."
- Katakam VSS, Arzumanyan M, Lin N, Bahadur V. (2027). System-scale design and analysis of desalination systems for meeting water needs of data centers. Water Research. 10.1016/j.watres.2026.126748 — only the abstract - the full paper is behind a subscription — the passage: "For MVC-based treatment (with MLD) of 50,000 ppm PW, we obtain FR = 753 L/1000 kg-feed, Winp = 36 kWh/m³-permeate and WC = 10.4 $/m³-permeate."
- Katakam VSS, Arzumanyan M, Lin N, Bahadur V. (2027). System-scale design and analysis of desalination systems for meeting water needs of data centers. Water Research. 10.1016/j.watres.2026.126748 — only the abstract - the full paper is behind a subscription — the passage: "Across representative conditions, SWUI increased from 2023-2030, spanning mild to substantial stress impacts."
- Barnett-Itzhaki Z. (2026). The water footprint of artificial intelligence: Emerging solutions and governance imperatives. Water Research. 10.1016/j.watres.2026.125866 — only the abstract - the full paper is behind a subscription — the passage: "Projections suggest AI's global water footprint could reach 4.2-6.6 billion cubic meters annually by 2027."
- Barnett-Itzhaki Z. (2026). The water footprint of artificial intelligence: Emerging solutions and governance imperatives. Water Research. 10.1016/j.watres.2026.125866 — only the abstract - the full paper is behind a subscription — the passage: "Many data centers are located in water-stressed regions."
- Barnett-Itzhaki Z. (2026). The water footprint of artificial intelligence: Emerging solutions and governance imperatives. Water Research. 10.1016/j.watres.2026.125866 — only the abstract - the full paper is behind a subscription — the passage: "While technologies, including cold-climate siting, natural water body cooling, waterless designs, and waste heat recovery, can reduce on-site demand, their deployment remains limited."
- Barnett-Itzhaki Z. (2026). The water footprint of artificial intelligence: Emerging solutions and governance imperatives. Water Research. 10.1016/j.watres.2026.125866 — only the abstract - the full paper is behind a subscription — the passage: "Achieving water-sustainable AI demands not merely technological optimization but fundamental policy reform integrating water constraints into computational infrastructure planning."
Rosa, L., Sangiorgio, M., Scanlon, B. R. et al. (2026). One Quarter of Global Data Centers are Located in Water-Stressed Areas. Environmental Science & Technology. https://doi.org/10.1021/acs.est.6c08088
Who paid: The article states the authors declare no competing financial interest and thanks Saoradh Enterprise Partners LLC of Boulder, Colorado, for providing the data centre facilities data set from their Hydrogen Market Model; it does not say who funded the study or whether funders had any say.