other · Environmental science & technology · la publicación, 1 oct 2026 · gratis
Uno de cada cuatro centros de datos del mundo opera en zonas con escasez de agua
Investigadores ubicaron 9,347 instalaciones en mapas de disponibilidad hídrica regional, sin medir el consumo real de cada edificio.
Versión breve · la versión detallada sigue, unos 8 min
Pregunte al chat de weeklyAI
Pregúnteme sobre la IA en su vida: le señalo las notas que weeklyAI ha publicado sobre el tema, esta semana y antes.
Las conversaciones se guardan mientras exista weeklyAI, para mejorar la publicación. Se responde en el idioma en que usted escribe.
- El estudio, de un vistazo
- Quiénes
- centros de datos identificados en el mundo
- Cuántos
- 9347
- Dónde
- todo el mundo
- Cuándo
- condiciones hidrológicas de 2001–2010 y un escenario de calentamiento de 3 °C
- Tipo de estudio
- análisis de ubicaciones sobre un modelo hidrológico
- Quién lo hizo
- Carnegie Institution for Science, Stanford, Politecnico di Milano, Universidad de Texas en Austin y ETH Zurich
- El límite que importa
- No mide el consumo de agua de cada centro; solo su exposición a la escasez de la cuenca.
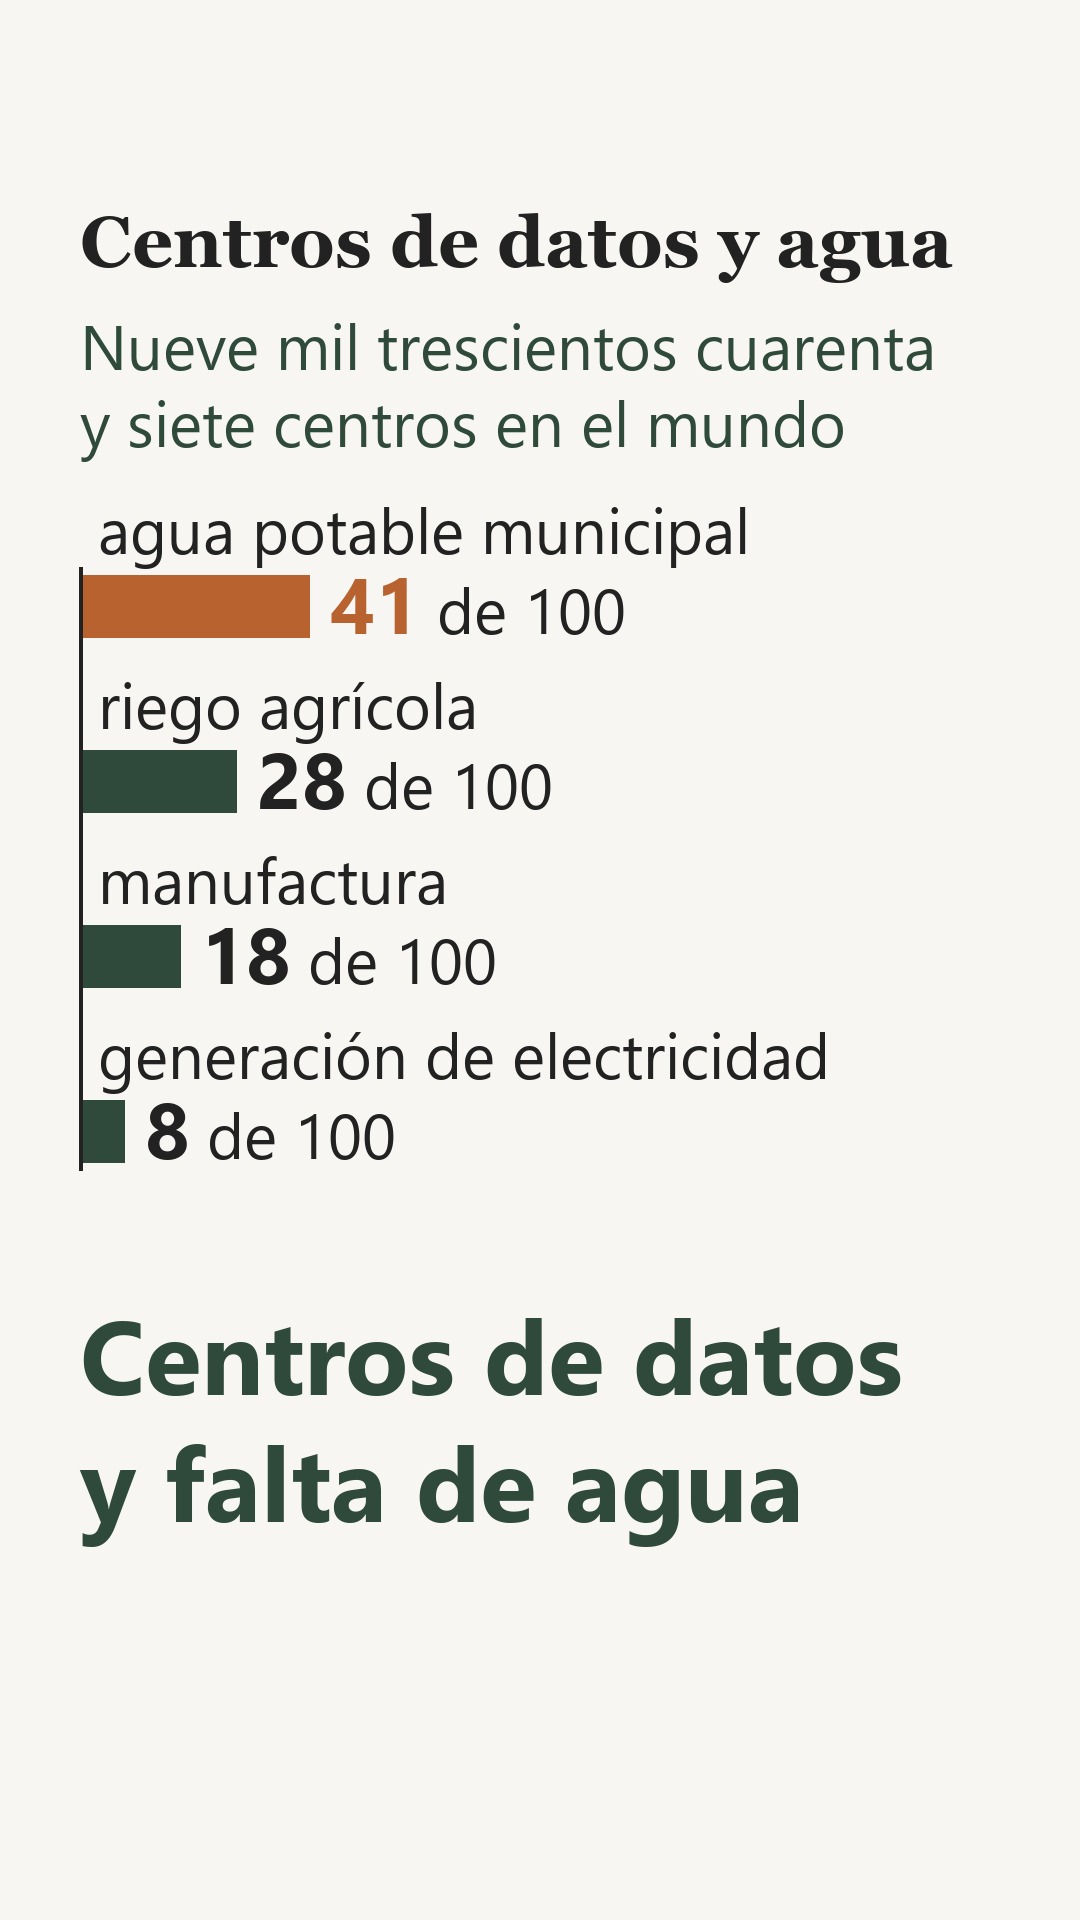
Porcentaje de los centros de datos del mundo ubicados en zonas donde ese sector es el que más agua consume; no mide cuánta agua toma el centro ni implica que haya conflicto.
Centros de datos en zonas con faltante de agua: hoy y con 3 °C de calentamiento
pasa de 25% a 33% de los centros identificados
pasa de 25% a 33% de los centros identificados
El estudio compara las coordenadas de cada edificio con el balance de la cuenca, pero no midió cuánta agua gasta cada centro ni qué sistema de enfriamiento utiliza.
Uno de cada cuatro centros de datos en el planeta (el 25%, es decir, 2,315 edificios) se encuentra en lugares donde la demanda de agua superó los recursos disponibles al menos un mes al año entre 2001 y 2010.
Investigadores del Carnegie Institution for Science y otras universidades cruzaron las coordenadas de 9,347 centros de cómputo en el mundo con un modelo de oferta y demanda de agua dulce. Al proyectar un calentamiento global de 3 grados centígrados, la cifra sube al 33% de los centros registrados, unos 3,045 edificios. Estados Unidos tiene 3,619 instalaciones, el 39% de las registradas en el mundo. El 21% de ellas está en zonas de escasez de agua. Ahí el agua disponible ya se disputa con el servicio de agua potable y los campos de cultivo.
La cifra no significa que estas instalaciones hayan dejado sin agua a sus vecinos. El estudio compara las coordenadas de cada edificio con el balance de la cuenca, pero no midió cuánta agua gasta cada centro ni qué sistema de enfriamiento utiliza. Los cálculos representan un límite superior de escasez, pues el modelo no contempla las obras que alivian la falta de agua en la práctica, como los acueductos que traen agua de otras cuencas, las plantas desalinizadoras, el manejo de presas o los acuerdos legales de distribución.
Tampoco se analizó el impacto en los recibos de luz, las tarifas eléctricas, la creación de empleo, los impuestos ni la compra de terrenos. El estudio no incluye testimonios ni quejas de vecinos que vivan junto a un centro de datos. La investigación muestra dónde coinciden estas construcciones con problemas hídricos previos, no si provocaron la falta del recurso.
Si anuncian la llegada de un centro de datos cerca de su casa, busque en la gaceta municipal o en el permiso de la autoridad hídrica qué volumen de agua potable le autorizaron extraer y de qué cuenca o pozo saldrá.
Qué significa para usted
El permiso de agua le dirá cuánto puede sacar el centro de datos y de qué cuenca o pozo saldrá, pero no cuánto gasta de verdad ni qué sistema de enfriamiento usa. El estudio no midió el consumo de ningún edificio ni si esa agua les falta a los vecinos. Conviene guardar el permiso y compararlo después con lo que el centro reporte.
Rosa, L., Sangiorgio, M., Scanlon, B. R. et al. (2026). One Quarter of Global Data Centers are Located in Water-Stressed Areas. Environmental Science & Technology. https://doi.org/10.1021/acs.est.6c08088
Quién pagó: El artículo no declara financiador y no reporta intereses financieros en conflicto; agradece a Saoradh Enterprise Partners LLC (Boulder, Colorado) por aportar el conjunto de datos de instalaciones de centros de datos de su Hydrogen Market Model.
Versión detalladaLos pasajes copiados del artículo, las ilustraciones y cada fuente con cuánto leímos de ella · 1631 palabras · unos 8 minLeerla →Cerrar
Un cuarto de los centros de datos del mundo ya está en zonas con problemas de agua
Un estudio global cruza la ubicación de 9,347 centros de datos con mapas de estrés hídrico. Lo que no puede decir es cuánta agua gasta el que está cerca de su casa.
Empiece con el recibo del agua. Cada mes llega una cantidad que usted pagó y un consumo que alguien midió. Ahora imagine un edificio cerrado, sin ventanas, que funciona día y noche y que necesita enfriar máquinas que no dejan de trabajar. Ese edificio también toma agua, y en muchos casos de la misma red que abastece a su colonia.
Un estudio publicado en *Environmental Science & Technology* revisó los 9,347 centros de datos identificados en el mundo y los cruzó con mapas de escasez de agua1. Los autores son Lorenzo Rosa, Matteo Sangiorgio, Bridget Scanlon, Marco Mazzotti, Joseph Berry y Anna Michalak, de instituciones en Estados Unidos y Suiza. La revista indica que los autores declaran no tener conflictos financieros. Los datos de ubicación los aportó una empresa privada, Saoradh Enterprise Partners, de Boulder, Colorado. El hallazgo central: una cuarta parte de esos centros, 2,315 en total, ya opera en zonas donde al menos un mes al año la demanda de agua supera a la que se renueva2.
El estudio no midió el consumo de ningún centro en particular. Solo tenía las coordenadas, sin capacidad instalada, sin tipo de enfriamiento y sin fuente de agua3. Lo que hizo fue superponer esas coordenadas sobre un modelo hidrológico que calcula, mes a mes, si en esa zona el agua alcanza. Es una estimación de exposición, no una medición de lo que sale por la tubería de un centro específico3.
Piense en una presa que se llena con la lluvia y se vacía con lo que todos toman de ella. El modelo del estudio hace algo parecido: resta a la lluvia que escurre lo que piden la agricultura, las casas, la industria y las termoeléctricas. Cuando lo que se pide supera lo que llega, hay un faltante1. En ese mapa, 41% de los centros de datos del mundo está en zonas donde el principal consumidor es el uso municipal, es decir, el agua potable de las ciudades4. Le siguen el riego agrícola con 28%, la manufactura con 18% y la generación de electricidad con 8%4.
Lo curioso es que un centro de datos consume agua de dos maneras. La directa viene del enfriamiento: los sistemas evaporativos típicos necesitan entre 1 y 3 metros cúbicos por cada megavatio-hora de carga de cómputo5. La indirecta viene de la electricidad: otros 1 a 10 metros cúbicos por megavatio-hora se van en generar esa luz, sobre todo si la planta es termoeléctrica5. Un racimo de centros de 1 gigavatio, operando a toda capacidad, puede asociarse con 10 a 40 millones de metros cúbicos de demanda de agua al año6. Para dimensionarlo: un metro cúbico son mil litros.
Bajo las condiciones hidrológicas de 2001 a 2010, el estudio encontró 7,032 centros sin faltante, 961 con uno a cuatro meses, 831 con cinco a ocho meses y 523 con faltante nueve a doce meses al año2. Con un calentamiento de 3 °C respecto a la era preindustrial, la cifra sube: 3,045 centros, 33% del total, quedarían en zonas con faltante7. Los autores aclaran que el conteo de centros probablemente se queda corto, sobre todo por instalaciones pequeñas o recién construidas que no aparecen en los registros.
En Estados Unidos está 39% de los centros de datos del mundo, y 21% de ellos en regiones con escasez de agua, donde el cruce con la demanda municipal y agrícola es marcado8. El detalle por país muestra que 79% de los centros estadounidenses, 2,855, no tiene exposición a faltantes; entre los demás, 260 viven uno a cuatro meses de faltante, 402 entre cinco y ocho, y 102 entre nueve y doce9. Con 3 °C de calentamiento, 505 instalaciones más quedarían afectadas, para un total de 1,269, el 35% del país10.
En Canadá, 35% de los centros, 95 en total, ya enfrenta al menos un mes de faltante al año11. El estudio no da el mismo nivel de detalle para América Latina: la base de datos global existe, pero el artículo se detiene en países como Estados Unidos, Reino Unido, Alemania, China, India, España o Australia. Lo que sí ofrece es el mapa mundial, donde aparecen zonas con estrés hídrico en el oeste de Estados Unidos, México, el Mediterráneo, Oriente Medio, India y el norte de China2.
Aquí está la lectura de weeklyAI. El patrón es viejo y se repite: un lugar con un recurso barato atrae a un usuario poderoso de fuera, y lo que ese usuario se lleva no siempre regresa en forma de beneficio local. El estudio sugiere que los centros de datos tienen capacidad financiera e institucional para asegurar su agua cuando la hay, y que el riesgo principal no es para ellos sino para los demás usuarios de la misma cuenca12. En zonas donde se planea un centro, lo esperable es que el agua y la luz se comprometan primero para el proyecto, mientras los beneficios visibles tardan en llegar. Esta lectura se equivocaría si los permisos de agua y los contratos de energía incluyeran compromisos medibles y auditados de reposición o mejora para la comunidad, y si el empleo y los ingresos fiscales se quedaran y crecieran en el lugar.
Conviene ver el otro lado. Los autores del estudio no afirman que los centros de datos hayan causado escasez en ninguna cuenca. Dicen que la coincidencia geográfica no implica competencia directa: en muchas regiones el agua alcanza para todos, y las autoridades suelen revisar la capacidad de suministro antes de aprobar a un gran usuario13. También señalan que las cifras de faltante son un límite superior, porque el modelo no representa transferencias entre cuencas, desalación, recarga de acuíferos, operación de presas ni reglas de asignación de derechos de agua13.
Hay otro matiz que importa. Muchos centros usan la misma agua potable o tratada que las ciudades, lo que crea presión con los usuarios urbanos en los picos de demanda y también dudas sobre la calidad, porque las extracciones y las descargas de agua caliente o tratada pesan sobre sistemas ya exigidos14. No todos los centros dependen del agua dulce: algunos usan agua residual reciclada, agua salobre, enfriamiento con agua de mar o sistemas secos, aunque cada alternativa tiene sus costos en energía, infraestructura y desempeño.
Otros trabajos de los que solo el resumen estaba disponible ponen el tema en una escala distinta. Según el resumen de un estudio sobre el futuro eléctrico de Gran Bretaña, lo único disponible de él, 21.7 gigavatios de capacidad de centros de datos añadirían entre 124 y 133 teravatios-hora al año de demanda eléctrica para 205015. Ese mismo resumen indica que las configuraciones enfriadas con agua consumen 297 mil millones de litros al año de agua directa, frente a 31 mil millones de las enfriadas con aire16. Y un análisis de estimaciones publicadas, también conocido solo por su resumen, encontró que las cifras sobre el agua que usan los centros de datos varían por varios órdenes de magnitud, y que esa dispersión responde a decisiones metodológicas, no al azar1718.
Separar consumo de extracción es una de esas decisiones. Según ese mismo resumen, dentro de las mismas fuentes, las estimaciones del agua indirecta ligada a la electricidad son entre 2 y 12 veces mayores que las del uso directo en el sitio19. Y otro resumen, el de una revisión sobre la huella hídrica de los grandes modelos de inteligencia artificial, sostiene que más de la mitad de los cien centros de datos más importantes del mundo estarían en regiones de alto estrés hídrico para 203020.
weeklyAI también leyó que las evaluaciones existentes suelen apoyarse en indicadores por instalación, como la eficiencia en el uso de energía o de agua, que dicen poco sobre el agua indirecta y sobre los efectos cruzados con el sistema eléctrico21. Y que las empresas tecnológicas más grandes consumieron miles de millones de metros cúbicos entre 2022 y 2024, con consumo que sube al mismo ritmo que la inteligencia artificial22. Ninguno de esos trabajos juzga el estudio de hoy: son lecturas de otros ángulos. Lo que sí dejan claro es que sin datos por instalación, cualquier cifra global es un promedio que esconde casos muy distintos.
Lo que el lector puede hacer con esto es concreto. Antes de que se apruebe un proyecto cerca de su casa, pida en el ayuntamiento y en la autoridad del agua el volumen exacto comprometido y a qué usuarios se les resta. Busque si ya existe un comité o una asamblea vecinal que lleve el tema del agua o de la luz en su zona, y súmese a su solicitud de información. Guarde copia del permiso y del estudio de caudal que la empresa presentó. Cuando escuche una promesa de empleos o de ingresos fiscales, pida la cifra por escrito y con fecha, y compárela después con los reportes del regulador o del municipio.
El estudio deja una pregunta abierta y la dice con todas sus letras: no se sabe si esta exposición se traduce en impactos operativos para los centros de datos o en consecuencias medibles para los demás usuarios del agua23. Responderla requeriría datos por instalación, escenarios de infraestructura futura y análisis locales de mayor resolución23.
Volvamos al recibo del agua. Usted sabe cuánto paga y cuánto consume. Lo que este estudio añade es que, en una de cada cuatro instalaciones del mundo, ese mismo recurso ya no alcanza para todos los que lo piden al mismo tiempo. La pregunta que puede llevar a la próxima junta vecinal es sencilla: ¿cuánta agua de la cuenca está comprometida, y a nombre de quién?
De dónde sale cada dato de contexto, y cuánto leímos de cada documento
- Rosa, L., Sangiorgio, M., Scanlon, B. R. et al. (2026). One Quarter of Global Data Centers are Located in Water-Stressed Areas. Environmental Science & Technology. https://doi.org/10.1021/acs.est.6c08088 - el artículo del que trata esta nota — el artículo completo — el pasaje: "This study assesses the current and future exposure of all 9347 currently identified data centers worldwide to water gap conditions, areas where water demand exceeds available supply, resulting in unsustainable water consumption and an increase in water stress."
- Rosa, L., Sangiorgio, M., Scanlon, B. R. et al. (2026). One Quarter of Global Data Centers are Located in Water-Stressed Areas. Environmental Science & Technology. https://doi.org/10.1021/acs.est.6c08088 - el artículo del que trata esta nota — el artículo completo — el pasaje: "We find that 25% of data centers would already have experienced at least 1 month of water gap annually under 2001–2010 hydrologic conditions."
- Rosa, L., Sangiorgio, M., Scanlon, B. R. et al. (2026). One Quarter of Global Data Centers are Located in Water-Stressed Areas. Environmental Science & Technology. https://doi.org/10.1021/acs.est.6c08088 - el artículo del que trata esta nota — el artículo completo — el pasaje: "This study does not aim to estimate facility-level water consumption of data centers, which depends on factors such as the IT load, water usage effectiveness, and cooling technology. Instead, we assess the exposure of data center locations to existing and future water stress by evaluating their spatial overlap with that of regional water gaps."
- Rosa, L., Sangiorgio, M., Scanlon, B. R. et al. (2026). One Quarter of Global Data Centers are Located in Water-Stressed Areas. Environmental Science & Technology. https://doi.org/10.1021/acs.est.6c08088 - el artículo del que trata esta nota — el artículo completo — el pasaje: "Data centers overlap with water demands from municipal (41%), irrigation (28%), manufacturing (18%), and power generation (8%) sectors."
- Rosa, L., Sangiorgio, M., Scanlon, B. R. et al. (2026). One Quarter of Global Data Centers are Located in Water-Stressed Areas. Environmental Science & Technology. https://doi.org/10.1021/acs.est.6c08088 - el artículo del que trata esta nota — el artículo completo — el pasaje: "Typical evaporative cooling systems require 1–3 m 3 of water per MWh of IT load, while an additional 1–10 m 3 of water per MWh is commonly embedded in electricity generation where thermal power plants dominate."
- Rosa, L., Sangiorgio, M., Scanlon, B. R. et al. (2026). One Quarter of Global Data Centers are Located in Water-Stressed Areas. Environmental Science & Technology. https://doi.org/10.1021/acs.est.6c08088 - el artículo del que trata esta nota — el artículo completo — el pasaje: "a 1-GW data center cluster operating at high utilization can therefore be associated with 10–40 million m 3 of water demand per year, depending on cooling architecture, power mix, and local climate."
- Rosa, L., Sangiorgio, M., Scanlon, B. R. et al. (2026). One Quarter of Global Data Centers are Located in Water-Stressed Areas. Environmental Science & Technology. https://doi.org/10.1021/acs.est.6c08088 - el artículo del que trata esta nota — el artículo completo — el pasaje: "33% of currently identified data centers would be in regions experiencing water gaps under future hydrological conditions."
- Rosa, L., Sangiorgio, M., Scanlon, B. R. et al. (2026). One Quarter of Global Data Centers are Located in Water-Stressed Areas. Environmental Science & Technology. https://doi.org/10.1021/acs.est.6c08088 - el artículo del que trata esta nota — el artículo completo — el pasaje: "The United States hosts 39% of data centers, with 21% located in water-scarce regions, where overlap with municipal and agricultural demands is pronounced."
- Rosa, L., Sangiorgio, M., Scanlon, B. R. et al. (2026). One Quarter of Global Data Centers are Located in Water-Stressed Areas. Environmental Science & Technology. https://doi.org/10.1021/acs.est.6c08088 - el artículo del que trata esta nota — el artículo completo — el pasaje: "In the United States, 79% (2855) of data centers are not exposed to water gaps ( Figure ). Among the remaining facilities, 260 experience 1–4 months, 402 face 5–8 months, and 102 endure 9–12 months annually."
- Rosa, L., Sangiorgio, M., Scanlon, B. R. et al. (2026). One Quarter of Global Data Centers are Located in Water-Stressed Areas. Environmental Science & Technology. https://doi.org/10.1021/acs.est.6c08088 - el artículo del que trata esta nota — el artículo completo — el pasaje: "In the United States, under +3 °C warming, 505 additional facilities are affected, for a total of 1269 data centers (35% nationwide)."
- Rosa, L., Sangiorgio, M., Scanlon, B. R. et al. (2026). One Quarter of Global Data Centers are Located in Water-Stressed Areas. Environmental Science & Technology. https://doi.org/10.1021/acs.est.6c08088 - el artículo del que trata esta nota — el artículo completo — el pasaje: "In Canada, 35% (95) of data centers encounter at least one month of water gaps per year."
- Rosa, L., Sangiorgio, M., Scanlon, B. R. et al. (2026). One Quarter of Global Data Centers are Located in Water-Stressed Areas. Environmental Science & Technology. https://doi.org/10.1021/acs.est.6c08088 - el artículo del que trata esta nota — el artículo completo — el pasaje: "While water scarcity is often framed as a potential constraint on data center expansion, in practice, data centers typically have the financial capacity and institutional priority to secure water supplies whenever water is available. As a result, the primary risk may not be to data center operations themselves but to other water users within the same basins."
- Rosa, L., Sangiorgio, M., Scanlon, B. R. et al. (2026). One Quarter of Global Data Centers are Located in Water-Stressed Areas. Environmental Science & Technology. https://doi.org/10.1021/acs.est.6c08088 - el artículo del que trata esta nota — el artículo completo — el pasaje: "These estimated water gaps should be interpreted as an upper-bound estimate because the analysis does not explicitly represent buffering and adaptation strategies, including interbasin water transfers, desalination, managed aquifer recharge, reservoir operations, and water rights or allocation mechanisms."
- Rosa, L., Sangiorgio, M., Scanlon, B. R. et al. (2026). One Quarter of Global Data Centers are Located in Water-Stressed Areas. Environmental Science & Technology. https://doi.org/10.1021/acs.est.6c08088 - el artículo del que trata esta nota — el artículo completo — el pasaje: "These facilities often rely on the same potable or treated municipal supplies, creating stress with urban users during periods of peak demand and constrained availability while also raising concerns about water quality as increased withdrawals and the discharge of heated or treated effluents place additional pressure on already stressed municipal and downstream systems."
- Hemmati M, Brahmbhatt P, Vergara-Zambrano J, Avraamidou S, Charitopoulos VM. (2027). Beyond facility-level metrics: A whole-system energy–water nexus analysis of data centre integration in Great Britain’s net-zero transition. Applied Energy. https://doi.org/10.1016/j.apenergy.2026.129288 — solo el resumen - no se pudo obtener el texto completo — el pasaje: "Under the modelled scenarios, 21.7 GW of installed DC IT capacity adds 124–133 TWh/yr of electricity demand to the GB energy system by 2050"
- Hemmati M, Brahmbhatt P, Vergara-Zambrano J, Avraamidou S, Charitopoulos VM. (2027). Beyond facility-level metrics: A whole-system energy–water nexus analysis of data centre integration in Great Britain’s net-zero transition. Applied Energy. https://doi.org/10.1016/j.apenergy.2026.129288 — solo el resumen - no se pudo obtener el texto completo — el pasaje: "water-cooled configurations consume 297 × 10 9 litres/yr of direct, on-site cooling water, compared with 31 × 10 9 litres/yr for air cooling"
- Davis JA, Marston LT, Shafiee-Jood M. (2026). A systematic analysis of data center water use, methodological divergence, and policy implications. Environmental Research Communications. https://doi.org/10.1088/2515-7620/aebc1a — solo el resumen - no se pudo obtener el texto completo — el pasaje: "Reported estimates of data center water use vary by several orders of magnitude, creating interpretive challenges for policymakers, utilities, and the public."
- Davis JA, Marston LT, Shafiee-Jood M. (2026). A systematic analysis of data center water use, methodological divergence, and policy implications. Environmental Research Communications. https://doi.org/10.1088/2515-7620/aebc1a — solo el resumen - no se pudo obtener el texto completo — el pasaje: "Results show that divergence is structured rather than arbitrary."
- Davis JA, Marston LT, Shafiee-Jood M. (2026). A systematic analysis of data center water use, methodological divergence, and policy implications. Environmental Research Communications. https://doi.org/10.1088/2515-7620/aebc1a — solo el resumen - no se pudo obtener el texto completo — el pasaje: "Within the same sources, estimates of indirect electricity-related water use (Scope 2) are approximately 2-12× larger than direct on-site use (Scope 1)."
- Tahmid T, Upaul S. (2026). Water footprint of large AI models: risks to global water security and sustainable optimization strategies. Water Policy. https://doi.org/10.2166/wp.2026.233 — solo el resumen - no se pudo obtener el texto completo — el pasaje: "Critically, over 52% of the world's top 100 data centers are projected to be located in high water stress regions by 2030, where AI infrastructure increasingly competes with agricultural, municipal, and ecological needs."
- Hemmati M, Brahmbhatt P, Vergara-Zambrano J, Avraamidou S, Charitopoulos VM. (2027). Beyond facility-level metrics: A whole-system energy–water nexus analysis of data centre integration in Great Britain’s net-zero transition. Applied Energy. https://doi.org/10.1016/j.apenergy.2026.129288 — solo el resumen - no se pudo obtener el texto completo — el pasaje: "existing assessments of DC sustainability rely largely on facility-level metrics such as Power Usage Effectiveness (PUE) and Water Usage Effectiveness (WUE), which provide limited insight into indirect water use and the cross-sector effects of DC integration on power-system infrastructure and decarbonisation pathways"
- Tahmid T, Upaul S. (2026). Water footprint of large AI models: risks to global water security and sustainable optimization strategies. Water Policy. https://doi.org/10.2166/wp.2026.233 — solo el resumen - no se pudo obtener el texto completo — el pasaje: "Major technology companies, including Google, Microsoft, and Meta, collectively consume billions of cubic meters in 2022–2024, with consumption rising alongside accelerating AI deployment."
- Rosa, L., Sangiorgio, M., Scanlon, B. R. et al. (2026). One Quarter of Global Data Centers are Located in Water-Stressed Areas. Environmental Science & Technology. https://doi.org/10.1021/acs.est.6c08088 - el artículo del que trata esta nota — el artículo completo — el pasaje: "The extent to which this exposure translates into operational impacts for data centers themselves or into measurable consequences for other water users remains an open question that will require future research integrating facility-level operational data, future infrastructure scenarios, and higher-resolution local assessments to address."
Rosa, L., Sangiorgio, M., Scanlon, B. R. et al. (2026). One Quarter of Global Data Centers are Located in Water-Stressed Areas. Environmental Science & Technology. https://doi.org/10.1021/acs.est.6c08088
Quién pagó: El artículo no declara financiador y no reporta intereses financieros en conflicto; agradece a Saoradh Enterprise Partners LLC (Boulder, Colorado) por aportar el conjunto de datos de instalaciones de centros de datos de su Hydrogen Market Model.
other · Environmental science & technology · the paper, 1 Oct 2026 · free
A Quarter of the World's Data Centres Sit Where Water Runs Short
Researchers laid 9,347 data centres over a model of local water supply and demand. It shows where centres sit, not what any one of them draws.
Short version · the longer version follows, about 7 min
Ask the weeklyAI chat
Ask me about AI in your life: I point you to the stories weeklyAI has published on it, this week and before.
Conversations are saved for as long as weeklyAI exists, to improve the publication. Answers come in the language you write in.
- The study at a glance
- Who
- 9,347 identified data centres worldwide
- How many
- 9347
- Where
- worldwide; United States hosts 39%
- When
- 2001–2010 baseline; future under +3 °C warming
- Kind of study
- analysis of what people did
- Who did it
- Carnegie Institution for Science, Stanford, ETH Zurich, UT Austin, Politecnico di Milano
- The limit that matters
- Locations only; no facility's actual water draw was measured
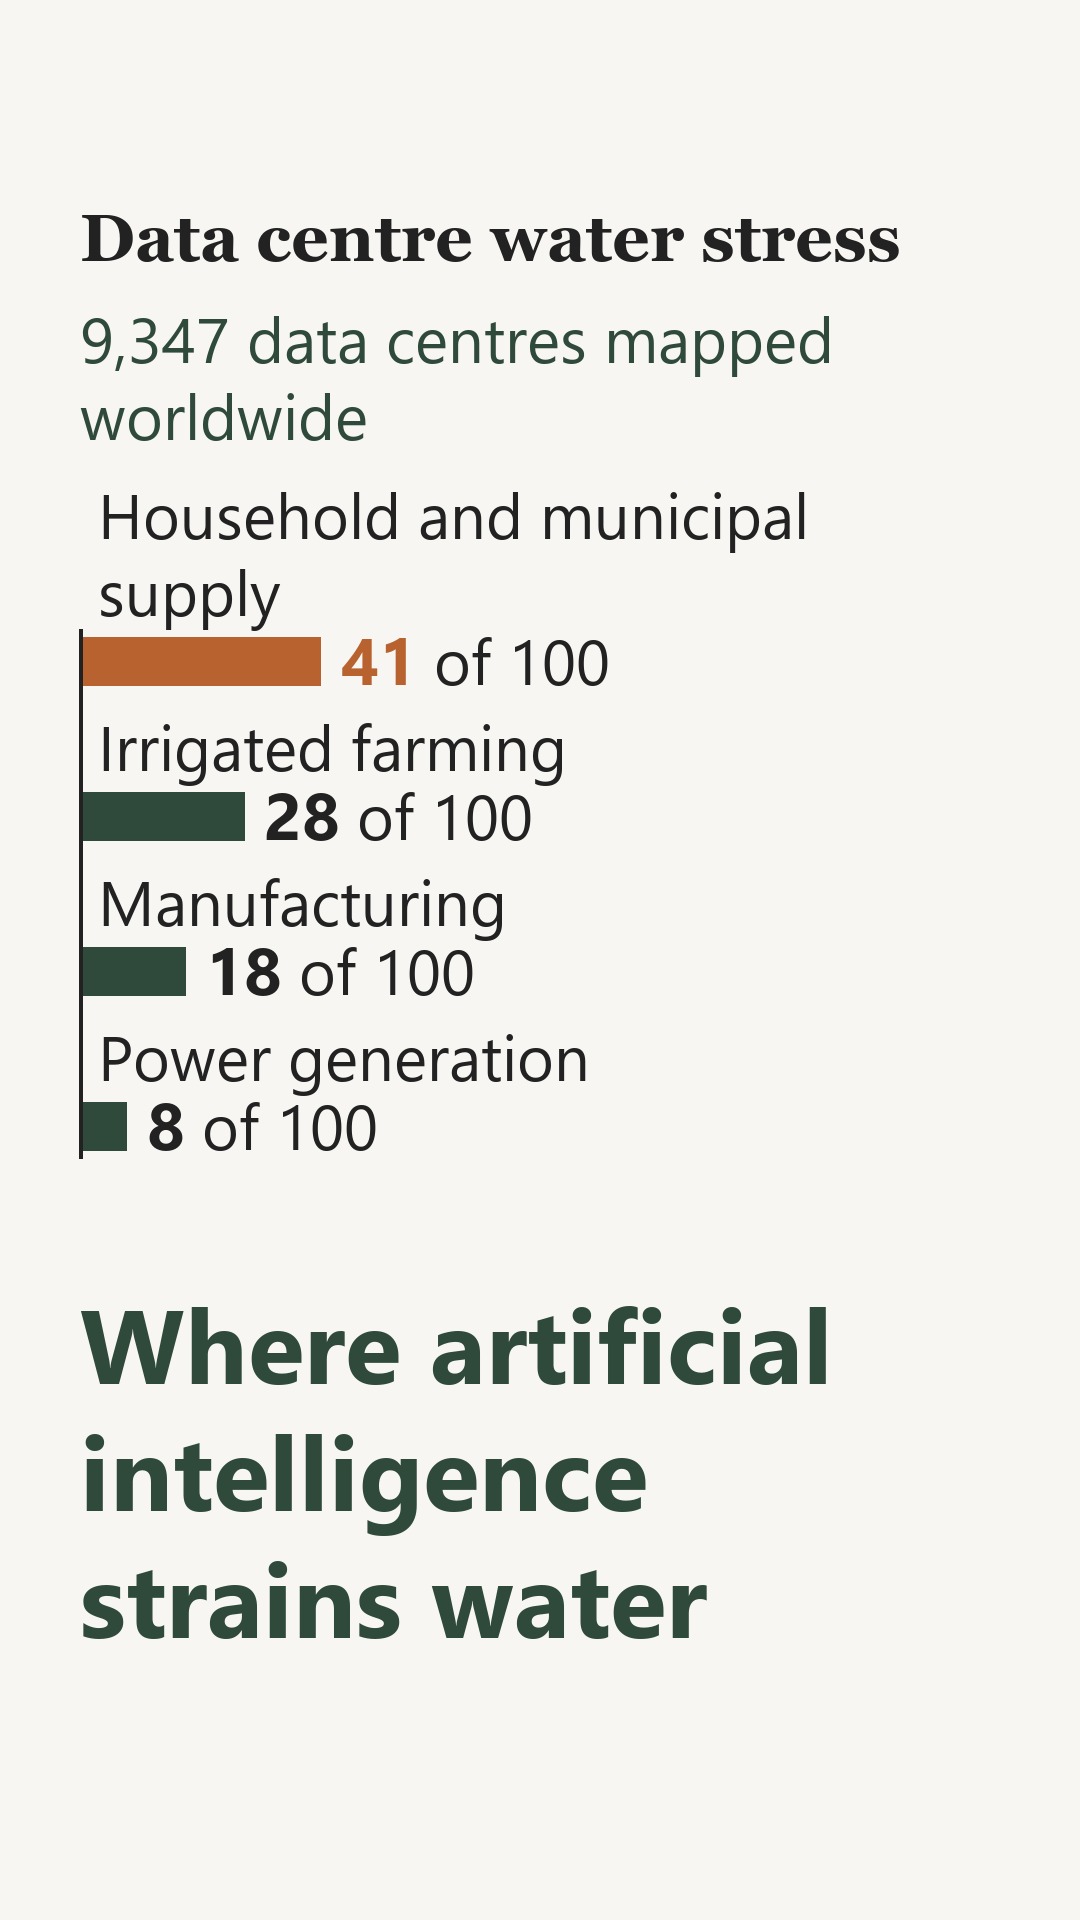
Share of the world's data centres sitting in areas where each kind of water use is the largest; these are shares of all data centres, not of water used, and the study did not measure any facility's own draw.
Data centres in places with a water shortfall: today's climate versus a world 3 °C hotter
25% of data centres already face at least one month a year; 33% would under the hotter climate
1,269 facilities affected under warming, 35% nationwide, after 505 more are added
Where the water is already spoken for, the study says the risk may fall less on the data centre than on everyone else in the basin.
Take the number 2,315. That is how many of the world's 9,347 identified data centres sit in places where, between 2001 and 2010, water demand outran the renewable supply for at least one month a year. One in four.
Researchers at the Carnegie Institution for Science and collaborators took a global list of data centres and laid their locations over a model of local water supply and demand. They counted the months each year when demand outran supply at each site. Then they ran it again for a world 3 °C hotter than pre-industrial times.
In the hotter world, 3,045 centres, or 33 percent, sit in such places. The United States hosts 3,619 of the world's centres, 39 percent of the total. Of those, 21 percent are in water-scarce regions. The study says the overlap with household and farm demand is pronounced there.
The study measures location against regional water gaps. It does not measure what any building actually draws, because the list it used held only map coordinates, with no capacity, cooling system or water source for any facility. The gaps are also an upper bound: transfers between river basins, desalination, reservoirs and water-rights rules are not in the model, so a place that looks stressed may in practice be buffered.
Where the water is already spoken for, the study says the risk may fall less on the data centre than on everyone else in the basin. Data centres, it notes, tend to have the money and the institutional priority to secure water when water is available.
Nothing here covers electricity bills or rate cases, jobs, taxes or land. The study reports no findings from people living beside a centre. It says plainly that whether this exposure turns into real consequences for a data centre, or for its neighbours, is still an open question.
So when a centre is proposed near you, the useful thing to look for is in the local record: which water user dominates that area, and what the permit actually allows.
What this means for you
When a data centre is proposed near you, the water permit and the council record are where the first real answers sit: which user already dominates that area, and how many months a year the local model shows demand outrunning supply. The study cannot tell you what one building will draw, or who ends up paying for it on the bill.
Rosa, L., Sangiorgio, M., Scanlon, B. R. et al. (2026). One Quarter of Global Data Centers are Located in Water-Stressed Areas. Environmental Science & Technology. https://doi.org/10.1021/acs.est.6c08088
Who paid: The article states no funder and reports no competing financial interest; it thanks Saoradh Enterprise Partners LLC of Boulder, Colorado, for providing the data centre facilities dataset from their Hydrogen Market Model.
The longer versionThe passages copied from the paper, the pictures, and every source with how much of it we read · 1442 words · about 7 minRead it →Close
A Quarter of the World's Data Centres Sit Where Water Runs Short. The Study Can't Tell You What Yours Uses.
Researchers mapped 9,347 data centres against regional water gaps. The finding is about where the buildings are, not what they draw.
A water bill arrives, and the rate has gone up. A drought notice comes through the door, and the lawn is out. Somewhere at the edge of town, a windowless building hums all night, and nobody has told you how much water it takes.
A study published in *Environmental Science & Technology* puts that building on a map. Researchers at the Carnegie Institution for Science and Stanford, with colleagues at ETH Zurich, the University of Texas at Austin and Politecnico di Milano, took a database of 9,347 operational data centres worldwide and laid their locations over a global model of monthly water gaps: places and seasons where water demand outruns the renewable supply1.
The headline number: 25 percent of those data centres, 2,315 facilities, sit in places that would have seen at least one month of water gap a year under hydrologic conditions from 2001 to 20102. Under a future climate warmed by 3 °C above preindustrial levels, the share rises to 33 percent, or 3,045 facilities3.
What a data centre is, plainly: a warehouse of servers that must be kept cool, and cooling is where the water goes. Typical evaporative systems use 1 to 3 cubic metres of water per megawatt-hour of computing load, and generating the electricity adds another 1 to 10 cubic metres per megawatt-hour where thermal power plants dominate4. A one-gigawatt cluster running hard can be tied to 10 to 40 million cubic metres of water demand a year, depending on how it is cooled, what generates its power and what the local climate is like5.
The scale of the sector's thirst is growing. Data centres currently consume 313 to 764 billion litres of water a year, and projections suggest that could more than double to 1,200 billion litres by 2030, about the annual household and municipal withdrawals of a country like the Netherlands6.
Where the facilities sit matters as much as how many. Globally, 41 percent of data centres are in areas where household and municipal demand is the largest water use, followed by irrigated agriculture at 28 percent, manufacturing at 18 percent and power generation at 8 percent7. The United States hosts 39 percent of the world's data centres, and 21 percent of them are in water-scarce regions where the overlap with city supplies and farms is pronounced8.
Inside the United States, 79 percent of facilities, 2,855, face no water gap under baseline conditions. Of the rest, 260 see one to four months a year, 402 see five to eight, and 102 see nine to twelve9. Add 3 °C of warming, and 505 more American facilities are affected, for a total of 1,269, or 35 percent nationwide10. In Canada, 35 percent of data centres, 95 facilities, encounter at least one month of water gaps a year11.
Consider what the study is not. The database holds coordinates and nothing else: no capacity, no electricity use, no cooling technology, no water source12. The authors say plainly that they did not estimate any facility's water consumption, and that they measured overlap with regional water gaps rather than any centre's contribution to them12. The gaps themselves are an upper-bound estimate, because transfers between river basins, desalination, managed aquifer recharge, reservoir operations and water-rights allocations are not represented in the model13. The study's methods section says the database likely undercounts the true global total, particularly for undisclosed, smaller or newly built facilities.
Grant the authors this much: they are careful about what the map can bear. Their own conclusion is that a quarter of these buildings sit in stressed places, and that whether this turns into an operating problem for the data centre, or a measurable loss for everyone else drawing from the same basin, is an open question14.
The institutional picture the authors draw is less reassuring. Data centres, they write, typically have the money and the standing to secure water whenever water is available, so the main risk may fall not on the facility but on other users in the same basin15. Many rely on the same treated municipal supply as households, which creates strain at peak demand and raises questions about water quality as withdrawals rise and heated or treated effluent is discharged downstream16.
Here is weeklyAI's reading. When a shared resource has no single owner, the user with money and legal standing tends to be served first, and everyone else absorbs the loss quietly, as lower pressure, higher rates or a new drought restriction. In a basin already short of water, expect the facility to secure its supply through a municipal contract or a priority allocation, and expect households, small farms and downstream users to feel the shortfall without a visible dispute with the company. This reading would be wrong if utility filings or council minutes showed a new large user conditioned on cuts elsewhere, or showed household service and rates untouched while the facility's draw was metered and published. What you can do with it: at a council or utility hearing, ask who holds the water right the facility will use, whether it is a new allocation or a transfer from existing users, and whether the permit sets a cap that is measured and reported.
There is a second pattern worth naming, and it is about bargains. Communities near a planned facility often trade quiet acceptance for promises of jobs, tax revenue or infrastructure, without securing a binding share of the water or a guaranteed local benefit. The promises may arrive as one-time payments or hiring preferences that are hard to enforce once construction ends. This expectation would weaken if host agreements or community benefit contracts fixed measurable local obligations, with penalties and public reporting. Ask to see the agreement itself, not the announcement: what is committed, for how many years, measured how, and what happens if the company falls short.
Other work on this subject, which weeklyAI also read, complicates the picture without overturning this study. One analysis of published estimates found that reported data-centre water use varies by several orders of magnitude, and that the divergence is structured rather than arbitrary: within the same sources, water tied to electricity generation runs roughly 2 to 12 times larger than on-site use, according to the summary of that study, the only part available1718. Another modelling study of Great Britain found that water-cooled data centres would consume far more direct cooling water than air-cooled ones, and that cooling design, not just location, drives the difference, according to its abstract, the only part available19. A third review projected that over half of the world's top 100 data centres would sit in high water-stress regions by 2030, again per its abstract alone20.
A caution about carrying this over: a global overlay of locations does not tell you what a specific building near you draws, and nothing in this study measures a single facility's intake. That is a limit on transfer, not on the finding.
The practical gap is reporting. Another review of the field argued that existing assessments lean on facility-level efficiency metrics that say little about water used upstream in power generation, according to its abstract21. A separate analysis of a hundred published estimates proposed a minimum standard of nine disclosure elements, from system boundary to data provenance, so that numbers can be matched to the decisions they inform, according to its abstract2223.
This reading would be wrong if, in your area, the permit file already names the source, the volume and the cap, and the utility reports the facility's draw alongside everyone else's. Then the question is not secrecy but arithmetic: whether the basin has room.
weeklyAI's expectation for homes like yours: as data centres anchor local power and water contracts, utility planning will tilt toward large steady customers, and small users will find less say in rate cases and less capacity to contest a project alone. Watch for who is allowed to intervene in a rate filing and whether residential users have a funded voice. Ask the regulator what happens to your rate if the large customer leaves or delays, and whether the facility pays for the grid upgrades it requires.
The windowless building at the edge of town still hums, and the bill still comes. What has changed is that you now know the first question to ask, and it is not how much water the company says it uses.
Whose name is on the water right, and is the volume metered and published?
Where each piece of context comes from, and how much of it we read
- Rosa, L., Sangiorgio, M., Scanlon, B. R. et al. (2026). One Quarter of Global Data Centers are Located in Water-Stressed Areas. Environmental Science & Technology. https://doi.org/10.1021/acs.est.6c08088 - the article this story is about — the whole article — the passage: "This study assesses the current and future exposure of all 9347 currently identified data centers worldwide to water gap conditions, areas where water demand exceeds available supply, resulting in unsustainable water consumption and an increase in water stress."
- Rosa, L., Sangiorgio, M., Scanlon, B. R. et al. (2026). One Quarter of Global Data Centers are Located in Water-Stressed Areas. Environmental Science & Technology. https://doi.org/10.1021/acs.est.6c08088 - the article this story is about — the whole article — the passage: "We find that 25% of data centers would already have experienced at least 1 month of water gap annually under 2001–2010 hydrologic conditions."
- Rosa, L., Sangiorgio, M., Scanlon, B. R. et al. (2026). One Quarter of Global Data Centers are Located in Water-Stressed Areas. Environmental Science & Technology. https://doi.org/10.1021/acs.est.6c08088 - the article this story is about — the whole article — the passage: "33% of currently identified data centers would be in regions experiencing water gaps under future hydrological conditions."
- Rosa, L., Sangiorgio, M., Scanlon, B. R. et al. (2026). One Quarter of Global Data Centers are Located in Water-Stressed Areas. Environmental Science & Technology. https://doi.org/10.1021/acs.est.6c08088 - the article this story is about — the whole article — the passage: "Typical evaporative cooling systems require 1–3 m 3 of water per MWh of IT load, while an additional 1–10 m 3 of water per MWh is commonly embedded in electricity generation where thermal power plants dominate."
- Rosa, L., Sangiorgio, M., Scanlon, B. R. et al. (2026). One Quarter of Global Data Centers are Located in Water-Stressed Areas. Environmental Science & Technology. https://doi.org/10.1021/acs.est.6c08088 - the article this story is about — the whole article — the passage: "a 1-GW data center cluster operating at high utilization can therefore be associated with 10–40 million m 3 of water demand per year, depending on cooling architecture, power mix, and local climate."
- Rosa, L., Sangiorgio, M., Scanlon, B. R. et al. (2026). One Quarter of Global Data Centers are Located in Water-Stressed Areas. Environmental Science & Technology. https://doi.org/10.1021/acs.est.6c08088 - the article this story is about — the whole article — the passage: "Data centers currently consume 313–764 billion liters per year, with projections suggesting that this could more than double to 1200 billion liters by 2030, equivalent to the annual household and municipal water withdrawals of a country like The Netherlands."
- Rosa, L., Sangiorgio, M., Scanlon, B. R. et al. (2026). One Quarter of Global Data Centers are Located in Water-Stressed Areas. Environmental Science & Technology. https://doi.org/10.1021/acs.est.6c08088 - the article this story is about — the whole article — the passage: "Data centers overlap with water demands from municipal (41%), irrigation (28%), manufacturing (18%), and power generation (8%) sectors."
- Rosa, L., Sangiorgio, M., Scanlon, B. R. et al. (2026). One Quarter of Global Data Centers are Located in Water-Stressed Areas. Environmental Science & Technology. https://doi.org/10.1021/acs.est.6c08088 - the article this story is about — the whole article — the passage: "The United States hosts 39% of data centers, with 21% located in water-scarce regions, where overlap with municipal and agricultural demands is pronounced."
- Rosa, L., Sangiorgio, M., Scanlon, B. R. et al. (2026). One Quarter of Global Data Centers are Located in Water-Stressed Areas. Environmental Science & Technology. https://doi.org/10.1021/acs.est.6c08088 - the article this story is about — the whole article — the passage: "In the United States, 79% (2855) of data centers are not exposed to water gaps ( Figure ). Among the remaining facilities, 260 experience 1–4 months, 402 face 5–8 months, and 102 endure 9–12 months annually."
- Rosa, L., Sangiorgio, M., Scanlon, B. R. et al. (2026). One Quarter of Global Data Centers are Located in Water-Stressed Areas. Environmental Science & Technology. https://doi.org/10.1021/acs.est.6c08088 - the article this story is about — the whole article — the passage: "In the United States, under +3 °C warming, 505 additional facilities are affected, for a total of 1269 data centers (35% nationwide)."
- Rosa, L., Sangiorgio, M., Scanlon, B. R. et al. (2026). One Quarter of Global Data Centers are Located in Water-Stressed Areas. Environmental Science & Technology. https://doi.org/10.1021/acs.est.6c08088 - the article this story is about — the whole article — the passage: "In Canada, 35% (95) of data centers encounter at least one month of water gaps per year."
- Rosa, L., Sangiorgio, M., Scanlon, B. R. et al. (2026). One Quarter of Global Data Centers are Located in Water-Stressed Areas. Environmental Science & Technology. https://doi.org/10.1021/acs.est.6c08088 - the article this story is about — the whole article — the passage: "This study does not aim to estimate facility-level water consumption of data centers, which depends on factors such as the IT load, water usage effectiveness, and cooling technology. Instead, we assess the exposure of data center locations to existing and future water stress by evaluating their spatial overlap with that of regional water gaps."
- Rosa, L., Sangiorgio, M., Scanlon, B. R. et al. (2026). One Quarter of Global Data Centers are Located in Water-Stressed Areas. Environmental Science & Technology. https://doi.org/10.1021/acs.est.6c08088 - the article this story is about — the whole article — the passage: "These estimated water gaps should be interpreted as an upper-bound estimate because the analysis does not explicitly represent buffering and adaptation strategies, including interbasin water transfers, desalination, managed aquifer recharge, reservoir operations, and water rights or allocation mechanisms."
- Rosa, L., Sangiorgio, M., Scanlon, B. R. et al. (2026). One Quarter of Global Data Centers are Located in Water-Stressed Areas. Environmental Science & Technology. https://doi.org/10.1021/acs.est.6c08088 - the article this story is about — the whole article — the passage: "The extent to which this exposure translates into operational impacts for data centers themselves or into measurable consequences for other water users remains an open question that will require future research integrating facility-level operational data, future infrastructure scenarios, and higher-resolution local assessments to address."
- Rosa, L., Sangiorgio, M., Scanlon, B. R. et al. (2026). One Quarter of Global Data Centers are Located in Water-Stressed Areas. Environmental Science & Technology. https://doi.org/10.1021/acs.est.6c08088 - the article this story is about — the whole article — the passage: "While water scarcity is often framed as a potential constraint on data center expansion, in practice, data centers typically have the financial capacity and institutional priority to secure water supplies whenever water is available. As a result, the primary risk may not be to data center operations themselves but to other water users within the same basins."
- Rosa, L., Sangiorgio, M., Scanlon, B. R. et al. (2026). One Quarter of Global Data Centers are Located in Water-Stressed Areas. Environmental Science & Technology. https://doi.org/10.1021/acs.est.6c08088 - the article this story is about — the whole article — the passage: "These facilities often rely on the same potable or treated municipal supplies, creating stress with urban users during periods of peak demand and constrained availability while also raising concerns about water quality as increased withdrawals and the discharge of heated or treated effluents place additional pressure on already stressed municipal and downstream systems."
- Davis JA, Marston LT, Shafiee-Jood M. (2026). A systematic analysis of data center water use, methodological divergence, and policy implications. Environmental Research Communications. https://doi.org/10.1088/2515-7620/aebc1a — only the abstract - the full text could not be fetched — the passage: "Reported estimates of data center water use vary by several orders of magnitude, creating interpretive challenges for policymakers, utilities, and the public."
- Davis JA, Marston LT, Shafiee-Jood M. (2026). A systematic analysis of data center water use, methodological divergence, and policy implications. Environmental Research Communications. https://doi.org/10.1088/2515-7620/aebc1a — only the abstract - the full text could not be fetched — the passage: "Within the same sources, estimates of indirect electricity-related water use (Scope 2) are approximately 2-12× larger than direct on-site use (Scope 1)."
- Hemmati M, Brahmbhatt P, Vergara-Zambrano J, Avraamidou S, Charitopoulos VM. (2027). Beyond facility-level metrics: A whole-system energy–water nexus analysis of data centre integration in Great Britain’s net-zero transition. Applied Energy. https://doi.org/10.1016/j.apenergy.2026.129288 — only the abstract - the full text could not be fetched — the passage: "water-cooled configurations consume 297 × 10 9 litres/yr of direct, on-site cooling water, compared with 31 × 10 9 litres/yr for air cooling"
- Tahmid T, Upaul S. (2026). Water footprint of large AI models: risks to global water security and sustainable optimization strategies. Water Policy. https://doi.org/10.2166/wp.2026.233 — only the abstract - the full text could not be fetched — the passage: "Critically, over 52% of the world's top 100 data centers are projected to be located in high water stress regions by 2030, where AI infrastructure increasingly competes with agricultural, municipal, and ecological needs."
- Hemmati M, Brahmbhatt P, Vergara-Zambrano J, Avraamidou S, Charitopoulos VM. (2027). Beyond facility-level metrics: A whole-system energy–water nexus analysis of data centre integration in Great Britain’s net-zero transition. Applied Energy. https://doi.org/10.1016/j.apenergy.2026.129288 — only the abstract - the full text could not be fetched — the passage: "existing assessments of DC sustainability rely largely on facility-level metrics such as Power Usage Effectiveness (PUE) and Water Usage Effectiveness (WUE), which provide limited insight into indirect water use and the cross-sector effects of DC integration on power-system infrastructure and decarbonisation pathways"
- Davis JA, Marston LT, Shafiee-Jood M. (2026). A systematic analysis of data center water use, methodological divergence, and policy implications. Environmental Research Communications. https://doi.org/10.1088/2515-7620/aebc1a — only the abstract - the full text could not be fetched — the passage: "We propose a minimum reporting standard of nine disclosure elements: system boundary, water metric, electricity attribution, cooling technology, operational efficiency definition, spatial scale, temporal resolution, growth scenario basis, and data provenance."
- Davis JA, Marston LT, Shafiee-Jood M. (2026). A systematic analysis of data center water use, methodological divergence, and policy implications. Environmental Research Communications. https://doi.org/10.1088/2515-7620/aebc1a — only the abstract - the full text could not be fetched — the passage: "We recommend consistent disclosure of these elements so that estimates can be matched to the decisions they can inform, such as benchmarking, utility planning, and permitting."
Rosa, L., Sangiorgio, M., Scanlon, B. R. et al. (2026). One Quarter of Global Data Centers are Located in Water-Stressed Areas. Environmental Science & Technology. https://doi.org/10.1021/acs.est.6c08088
Who paid: The article states no funder and reports no competing financial interest; it thanks Saoradh Enterprise Partners LLC of Boulder, Colorado, for providing the data centre facilities dataset from their Hydrogen Market Model.
The findings of other studies mentioned here come from this document; those studies were not opened one by one.